Trader Growth Institute
Understand the chart.
Start with Daily Zones.
Daily Zones mark areas on the daily chart where price previously moved strongly. Use them to watch price reactions and plan your risk.
Free market updates. Chart explanations. Unsubscribe anytime.
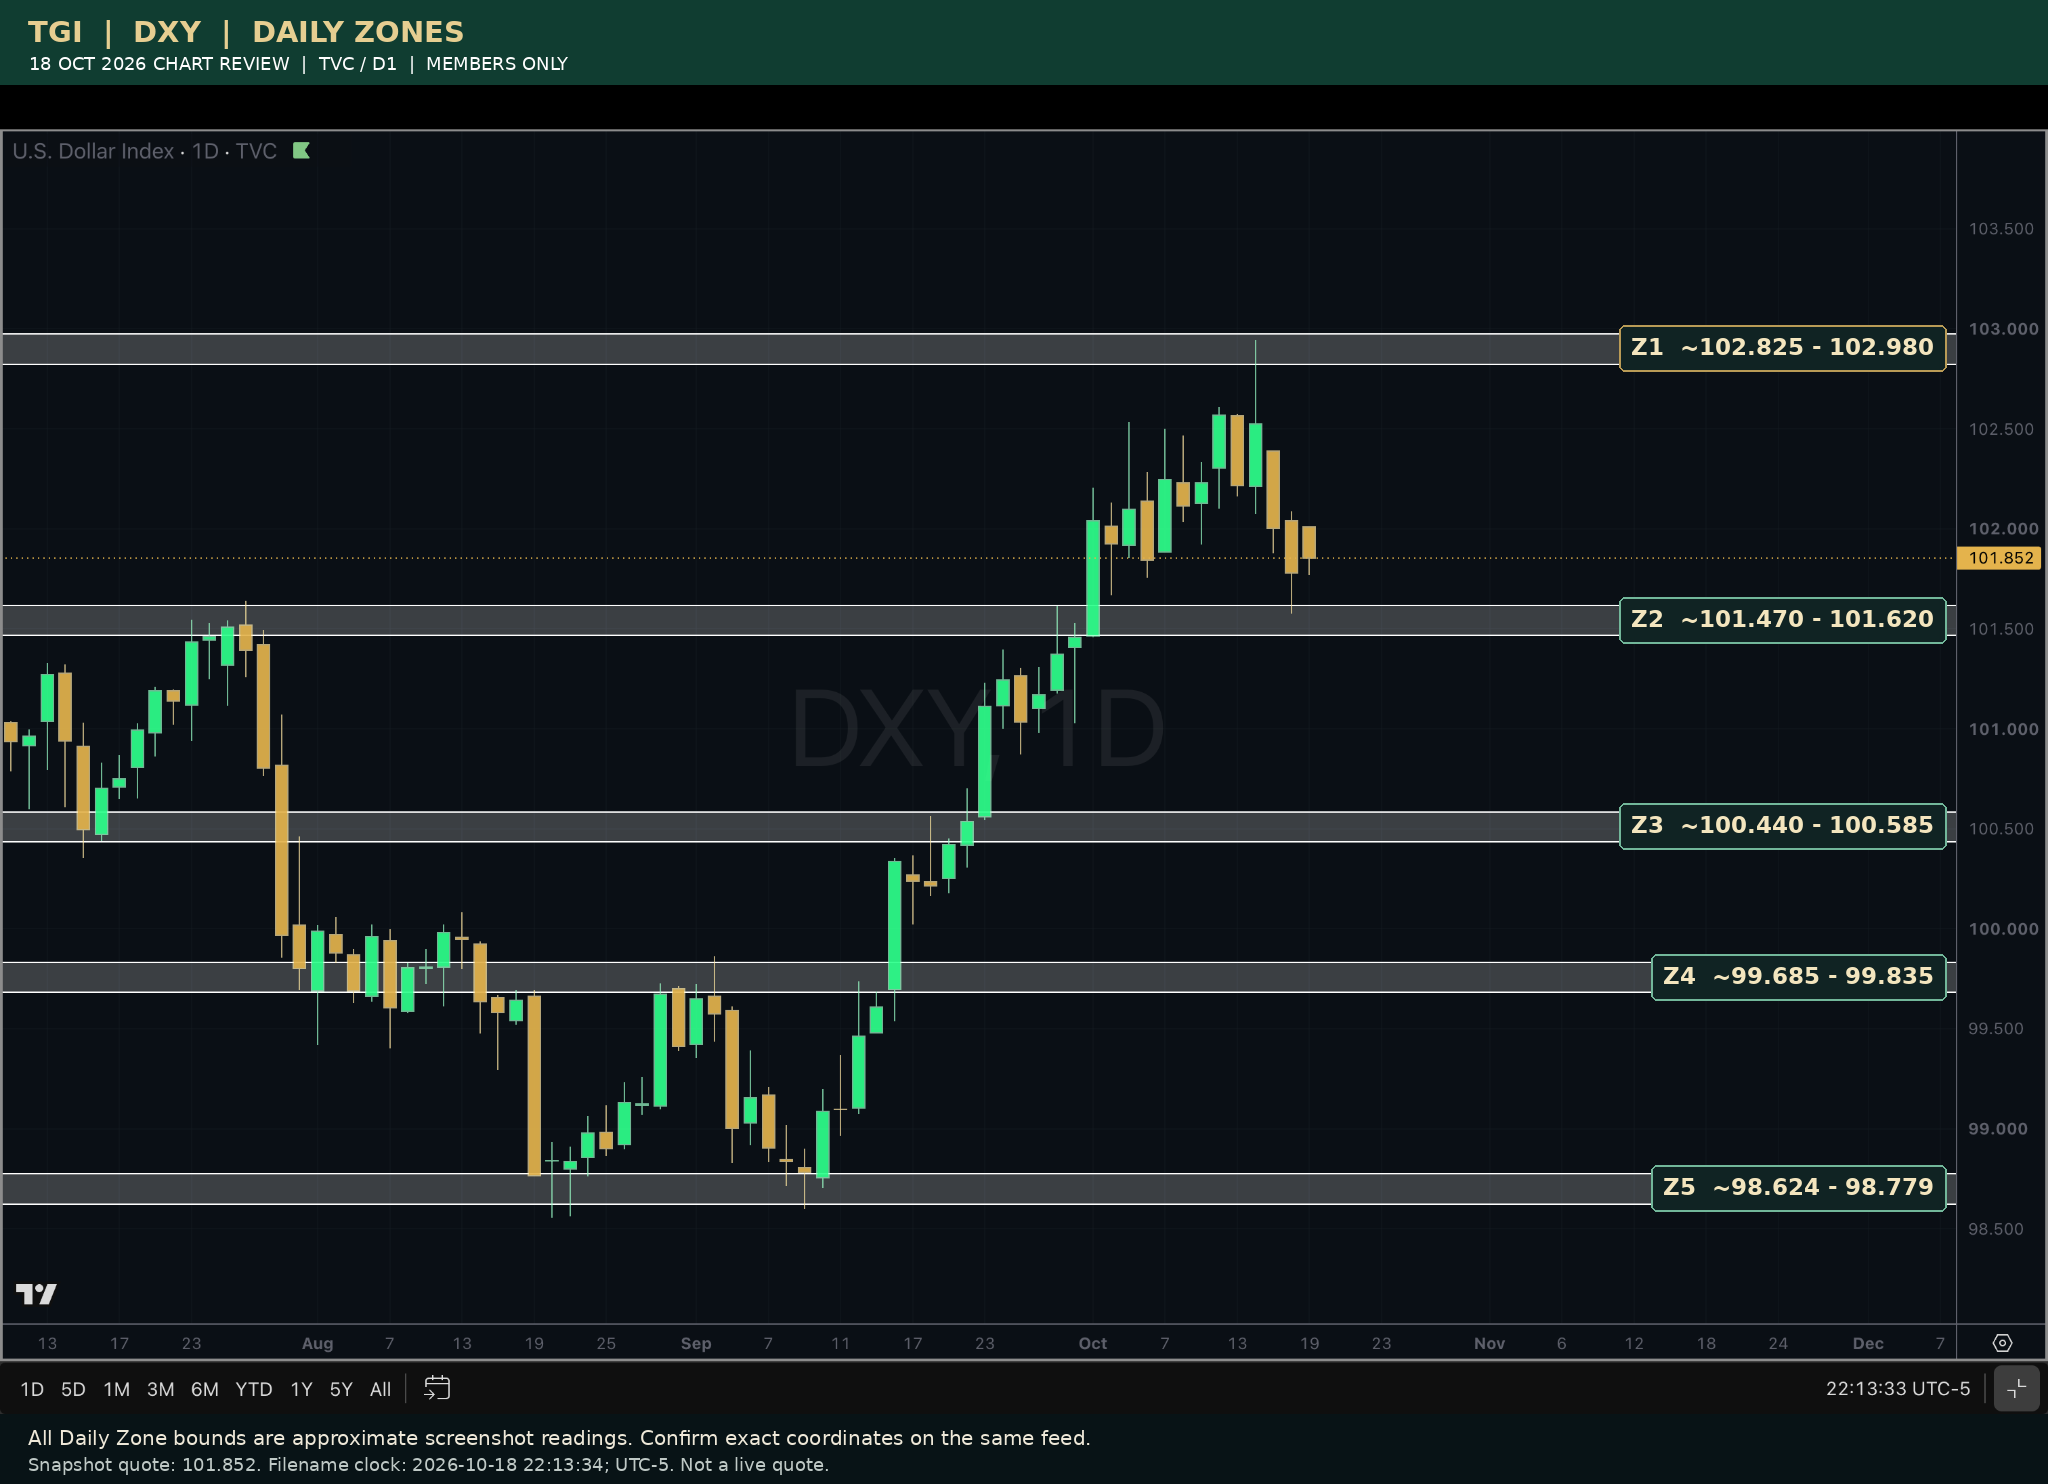 Open full chart
- Daily Zones
- The marked price areas in this review.
- Candles
- One day per candle in this chart.
- Snapshot price
- The quote recorded at the time of capture.
TGI Operating Desk membership
Get Jay’s Daily Zones.
See the price areas Jay is watching and the thinking behind them. Study his published zones, chart updates and market outlooks across currencies, commodities, indices and crypto.
$99/month
Explore the Operating Desk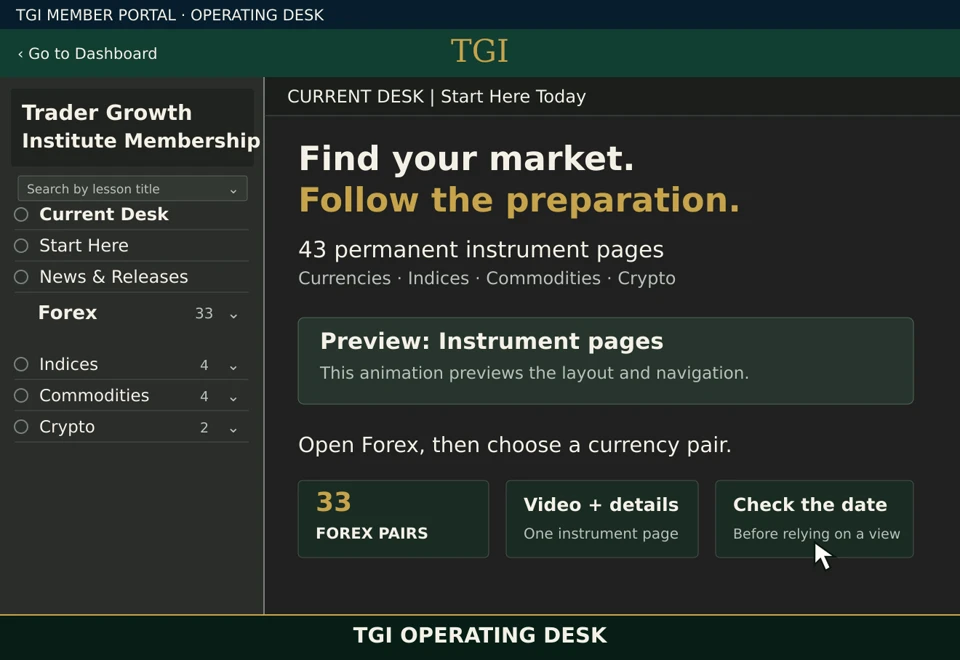

Founder & author
Why Jay started TGI.
A useful chart needs a clear plan. Jay started TGI to explain his Daily Zones approach through a book, market updates and chart reviews, so you can study the process and make your own decisions.
Jay Bryan is a trader and the author of Daily Zone Command™. He shares the price areas he watches, the reactions he waits for, and the risk he plans before a trade.
FTMOMaximum Allocation
VerifiedPayout History
15+ YearsMarket Experience
Your free weekly market update
Intelligence Briefing
Economic newsNews that could move the market
Daily Zones & chartsKey price areas and chart explanations
Plan your riskWhat to watch and what could change
Choose your starting point
Follow the updates. Learn the method. Study the charts.
Start freeWeekly updatesFollow Jay’s market updates and chart explanations.
→Learn the methodDaily Zone Command™The book explains how to identify and use Daily Zones.
→Study the chartsTGI Operating DeskSee Jay’s published zones and the thinking behind them.
→Watching price at a zone
Price can react in different ways.
Price can move away from a zone. Wait for your entry conditions.
Example sequence. Price does not always follow this order.
Daily Zones chart example
Daily Demand: before and after a reaction.
Use the slider to compare a marked area with one possible price reaction. Price can also move through a zone.
Simplified example, not a trade result.
Explore the Daily Zone Command™ bookResources
More ways to study and practice.
Swipe through the resources, or use the arrows.
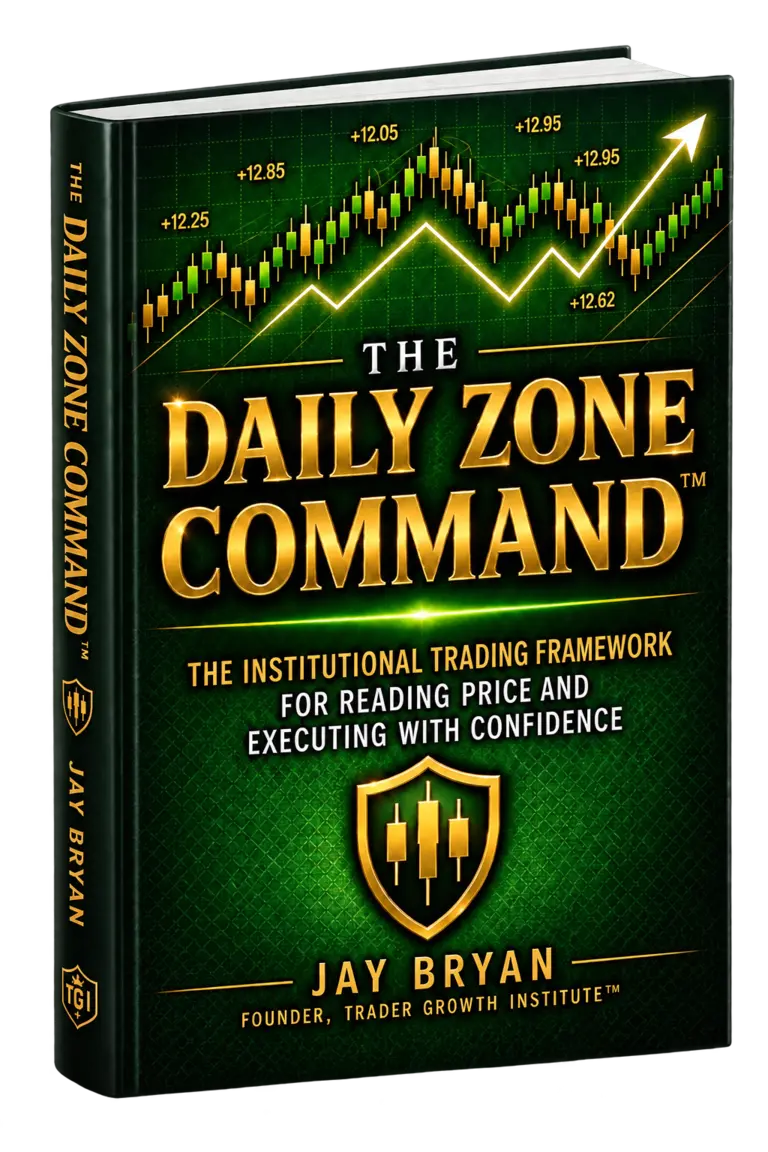
Book by Jay BryanThe Daily Zone CommandLearn the Daily Zones method →
Private session with JayDaily Zone Command™ MentorshipReview your charts with Jay →
TGI membershipTGI Operating DeskExplore Daily Zones and market updates →
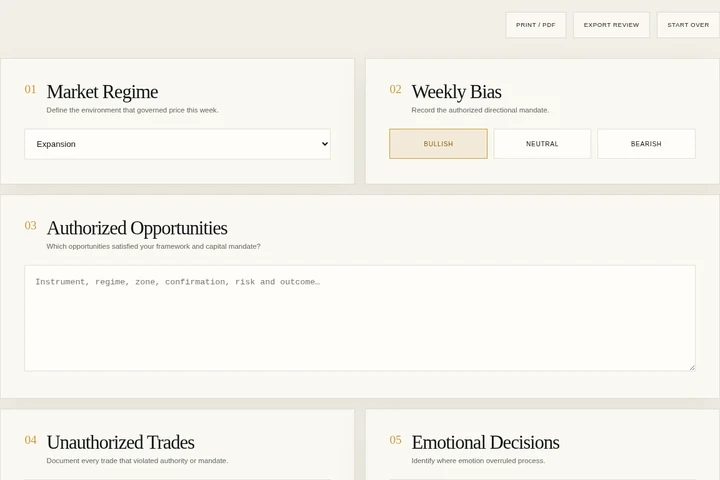
Interactive templateWeekly Capital ReviewReview your trading decisions →

Free weekly publicationTGI Intelligence BriefingFollow the weekly market update →
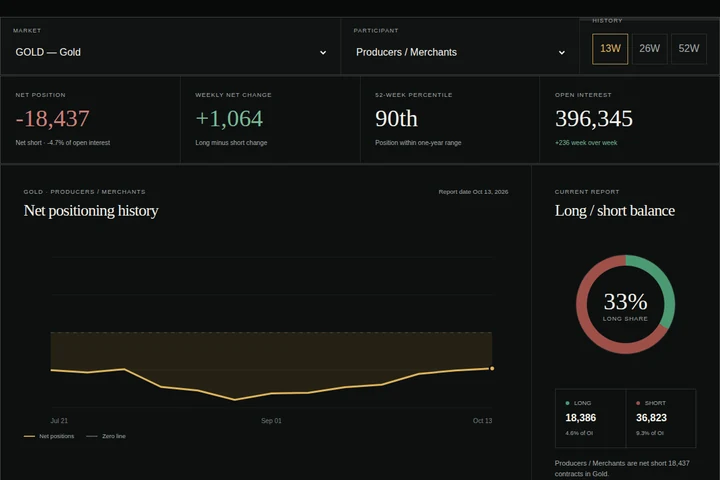
Official CFTC positioningCOT DashboardExplore large traders’ reported positions →
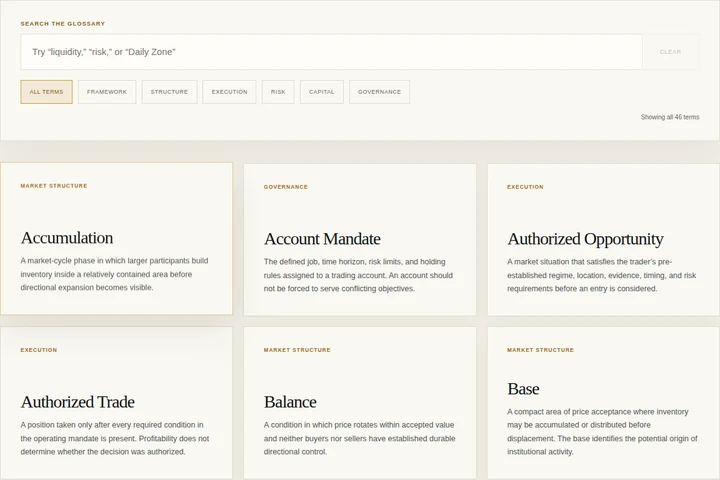
Interactive referenceTGI Trading GlossaryLook up unfamiliar trading terms →

Execution standardCDZA™ CertificationRead the certification requirements →
The TGI Intelligence Briefing
Start with the next free market update.
Free weekly updates from TGI. Unsubscribe anytime.
Educational chart examples, not instructions to buy or sell. Zones can fail, and trading involves risk. Updates are published as conditions develop; Daily Zones is the method, not a promise of daily trade alerts.